Article

How to get started with Google Analytics?

Ota yhteyttä 1
How to get started with Google Analytics? Google Analytics can help you get to know your visitors better, spend resources more efficiently and works as a stepping stone for overall business growth. So, start learning and have fun while at it!

If you haven’t used data and Google Analytics to your advantage yet, now is a good time to start. In many organizations there is untapped potential that the use of Google Analytics will reveal. It will provide you valuable information to act on and back up your business decisions. In this article, we will cover some basics to get you started.

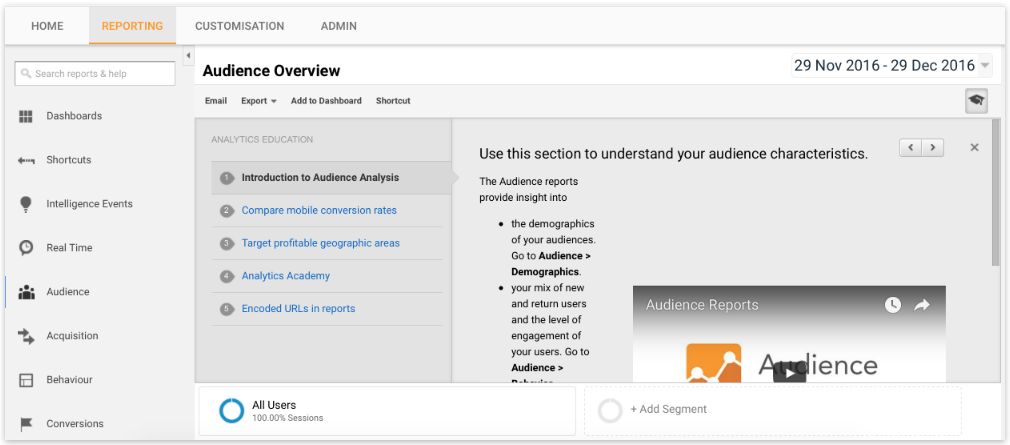
There are several reports in Google Analytics. Let’s go through the reporting sections (left sidebar).

  • Dashboards: you can build data sets here for different purposes. This is a good place to build a dashboard that you want to look at daily or weekly. You can get nice visuals of your important figures and monitor changes effortlessly.
  • Shortcuts: save links to most used or favourite reports here.
  • Intelligence events: if there are dramatic changes, for example, in your traffic or conversions, Google will save that information in Intelligence Events. You can also set custom alerts for certain changes which will be sent to your email.
  • Real time: this section shows the visitors on your site at that very moment. You can see for example where they came to the site from and what pages they are visiting.
  • Audiences: your visitor data can be found here. The data here offers you a chance to get to know your visitors better. Information includes (as available) age, gender, geographic location, interests, and more.
  • Acquisition: all different traffic sources to your website are shown here. You will most likely use these reports a lot. Use this section to see which channels and campaigns perform well (scale) and which not so well (optimize or reconsider). Compare different traffic sources and use this section to help you make decisions where to focus and put more effort in.
  • Behaviour: See data about your pages and content. Here you can track interesting information, for example, about your most visited pages. You can also find a section called Experiments here. This is Google’s own conversion optimization tool and very handy for running A-B-tests. Conversion optimization is highly recommended, however, it's good to first get familiar with the basic use of Google Analytics.
  • Conversions: See visitor paths that lead to conversions, get data on how different traffic channels work together and see beyond initial conversion data in the Acquisition section. Typically for example paid campaigns influence also organic and direct traffic, so remember to look at your attribution reports before you kill any campaigns that seem inefficient at first glance. It’s a multi-channel world so use this section to understand your conversion paths better and evaluate the overall impact of your marketing efforts.

Using data

After you get familiar with the interface and click around, where should you actually start? First, you could create a custom dashboard or report with the data you consider critical to your business and keep an eye on the traffic regularly - maybe even make it your daily routine.

Start to look for valuable insights from your data. There are many ways to organize and filter data. Try filtering it with different type of segments. Segments can help you find certain visitor groups that convert exceptionally well. You can segment your visitors by things they have in common - like traffic sources, date and time, device, marketing channels, geography or certain behaviour (for example returning visitor).

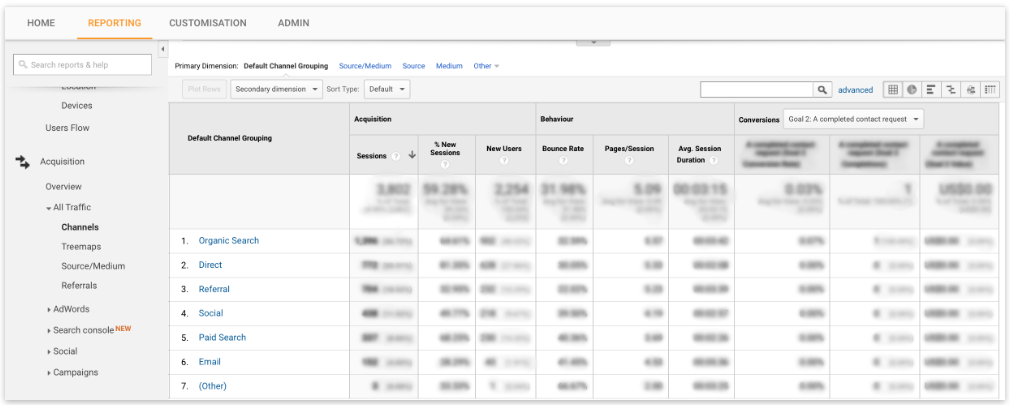
You can even build your own custom segments. As an example, open your All Traffic - Channels report and segment the data with “Mobile Traffic”. How many visitors use mobile? How does your site convert on mobile? Based on the significance of your mobile traffic, do you pay enough attention to it? Is there something you can do to improve the mobile experience? Google Analytics is a great tool to find focus points and prioritize efficiently.

Relevancy

You might be wondering which changes in data are significant and if you should act on them. It is very easy to get too caught up in short-term data swings and percentages especially for sites with smaller traffic. Get context, look at your past data and use data sets large enough to make decisions.

Remember that there could be some external factors which cause some data fluctuation, for example, a competitor's activity or national holidays. With practice, you will get a better sense of what is relevant and actionable. To get an idea how your site is doing compared to others in your industry, have a look at the Benchmarking report in Google Analytics (under Audiences).

Also keep in mind that visitors don’t necessarily buy right away and can use many channels, browsers, and devices before converting. Get to know attribution modeling to understand the bigger picture.

Tips

  • Link your Google Analytics to your AdWords and Search Console accounts.
  • Build audiences for remarketing (Admin - Audience Definitions - Audiences). You need a bit of data gathered there before they can be used and it's good to have them ready.
  • Exclude your office IP address to keep your data cleaner.
  • Find and import ready dashboards, reports and remarketing lists from Google Analytics Solution Gallery - for free. They are even categorized for different purposes like ecommerce or content.
  • Use Annotations to keep track of, for example, the day you started campaigns or made changes to your site. When you are analyzing data, you can handily find dates that might have influenced your data.
  • Google has made dashboard and report sharing easy, so you can build and automate reports for different departments or team members in your company. For example, your web developers might be interested in a more technical report with information about browsers, devices, site speed etc.
  • If you have an ecommerce site, setting up goal funnel is crucial. The goal funnel lets you see where your visitors drop off.
  • Make sure all your campaigns (Facebook, Twitter etc.) are properly tagged and you will see the data in Google Analytics correctly. You can use Google’s URL builder to tag your campaigns.
  • Google offers a free course that you can take to learn more about Google Analytics. You can become certified, too, by taking the Google Analytics Individual Qualification exam.

Google Analytics can help you get to know your visitors better, spend resources more efficiently and works as a stepping stone for overall business growth. So, start learning and have fun while at it!

Utilize your Analytics data with a high-quality responsive website. LianaCMS is a versatile and easy-to-use tool for creating and maintaining responsive websites and landing pages.

Oliko artikkeli mielestäsi mielenkiintoinen?

Tilaa kuukausittainen uutiskirjeemme joka sisältää aina uusimmat mielenkiintoiset artikkelit.

Tilaa uutiskirje tästä

Kommentit (1)

16.10.2017

email database marketing

This is a good post. This post gives truly quality information. I’m definitely going to look into it. Really very useful tips are provided here.

- email database


Artikkelin kommentointi

More news

How to find key opinion leaders?

Key opinion leader surveys can be done as one-off by monitoring the current situation. In the best case, however, finding influencers is a part of everyday communications and marketing that includes social media and media monitoring, press releases and PR.

Read More